National Bankruptcy Research Center November 2010 Bankruptcy Filings Report
|
The raw numbers suggest that bankruptcy filings in November fell steeply from the previous month (to 115,000 from 130,000), the lowest monthly filing total since February of this year. But it would be a bit much to read this as a major turn in bankruptcy filing trends, because for the last several years October has had the highest filings of any month in the year. Thus, as a seasonally adjusted matter, filings in November were only about two percent lower than in October, and they were actually two percent higher this year than they were last October. And year-to-date filings for 2010 are still nine percent higher than last year’s. But it does seem clear that the rapid rise in filings we’ve experienced for the last two years is coming to an end.
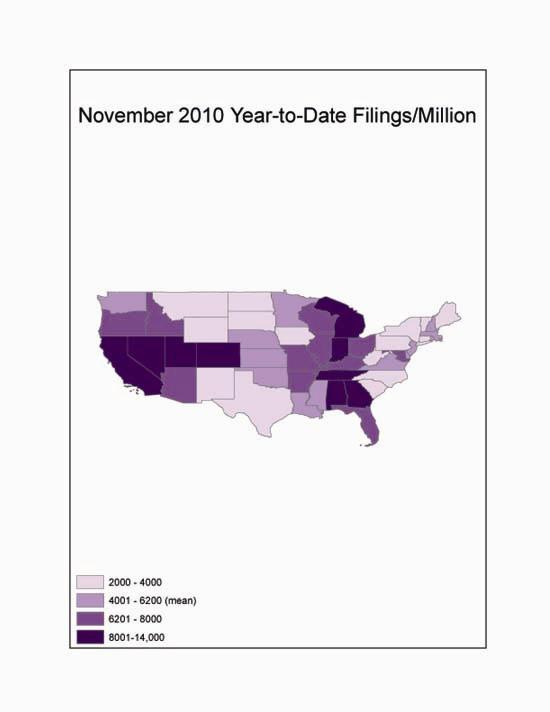
Nationwide, filings this year to date amount to about 6000 filings per million individuals, about 1 in every 160 people. Through the course of 2010 the filing rates have become increasingly disparate throughout the country. As the attached map shows, the highest filing rates are concentrated in the Southwest and a swathe cutting up from the Southeast. Thus, on a population-adjusted basis, Nevada has substantially more than twice the national filing rate (13,800 filings per million this year). In the Southeast, Georgia and Tennessee follow with about 50% more than the national average (10,000 filings per million this year). The lowest filing rates, by contrast -- seven states had rates less than half the national average – are scattered throughout the country, generally in states remote from the aggressive lending activity that characterized the bubble of the last decade: Alaska, the District of Columbia, South Carolina, Texas, North Dakota, South Dakota, and Vermont.
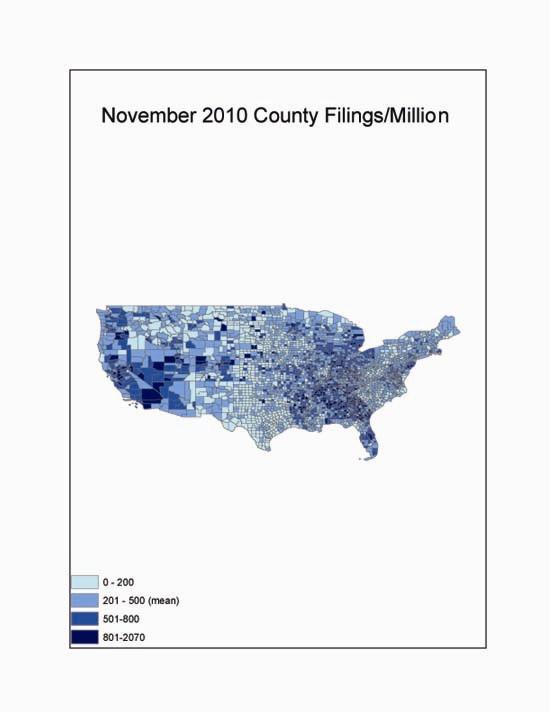
The variation at the county level is particularly provocative. As the attached map shows, the counties with the highest filing rates (adjusting for county population) in November are concentrated in the Southeast. Excluding small counties with less than ten filings, Polk County, Tennessee (northeast of Memphis) had the highest rate, more than 2000 filings per million in November alone, more than four times the national average. Eight of the next nine counties with the highest filing rates are located in Tennessee, Georgia or Alabama. The most noteworthy urban county (second highest overall) is Shelby County, Tennessee (Memphis), which had about 1800 filings per million (more than three times the national average). At the other end of the spectrum, the lowest filing rate in the country last month among urban counties (with a population more than 100,000) was in Brazos County, Texas (Bryan) – with a filing rate less than a tenth the national average.
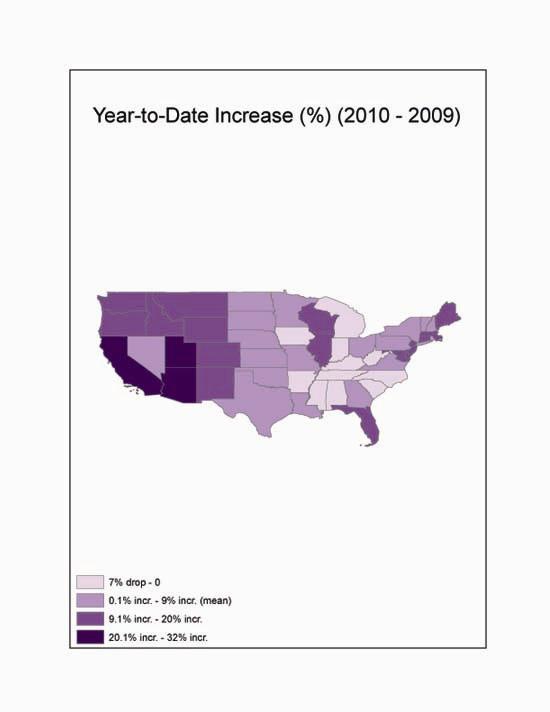
Another accelerating trend in the data is the sharp disparity in changes since last year. Where a few states (mostly in the Deep South) already have begun to see rates fall after the recession, some states continue to experience sharp increases, even by comparison to the elevated filing rates of 2009. Thus, filings in Hawaii are 32% higher than in 2009 and 25% higher in California, Arizona, and Utah. In contrast, despite the nationally noteworthy high filings in and near Memphis, and Tennessee’s place near the top of 2010 filing totals, filings throughout Tennessee have fallen seven percent since last year. Filings have fallen by lesser amounts in West Virginia, South Carolina, Iowa, Alabama, Mississippi, Kentucky, North Carolina, and Michigan. As the attached maps suggest, of the two parts of the country where bankruptcy filings spiked most notably during the recession, one (the Southeast) is recovering rapidly while the other (the Southwest) is falling into further distress.
This analysis was performed on data collected by the National Bankruptcy Research Center (NBKRC) by NBKRC contributor Professor Ronald Mann of the Columbia Law School.
|