National Bankruptcy Research Center February 2010 Bankruptcy Filings Report
|
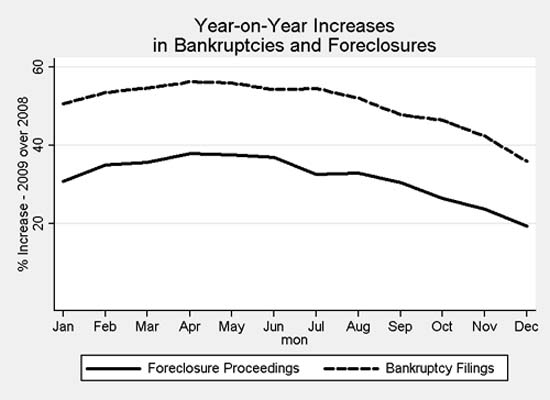
Bankruptcy filings in February 2010 continued at a steady level: the total filings were about 112,000, up slightly from 103,000 in January, but down from 114,000 in December. Because February filings normally are 10-15% higher than January filings, the slight increase is not significant. On a year-to-date basis, filings in January and February of this year are 14% higher than the same time a year ago. To put that in context, filings last summer were more than 30% higher than the previous year’s filings. It appears, therefore, that the rate of increase in filings attributable to the financial crisis is continuing to fall. To illustrate the steady decline, the attached line graph illustrates the parallel declines in the year-on-year growth in bankruptcy filings and foreclosure proceedings (using rolling three-month averages for both).
The recovery is very much a regional occurrence, however. Seven states (mostly in the South) have filing rates lower this year than last year. At the same time, six states (including Arizona and California) have filing rates more than 35% higher than the same time last year. A reasonable explanation is that the States that were less closely connected to the bubble economy have begun to recover much more rapidly than those that were more closely connected. An attached heat map displays the disparity graphically.
The filings also reflect the continued prevalence of Chapter 7 (liquidation) filings; only 29% of the filings this year sought relief under Chapter 13 (rehabilitation), down from a 31% share during the same period last year. The continuing decline in the share of Chapter 13 filings contrasts with the strong push by Congress in its 2005 bankruptcy legislation to encourage bankrupts to choose Chapter 13 rather than Chapter 7. As is typical, there was a substantial variation among the States in the prevalence of bankrupts seeking Chapter 13 relief. The States with the highest share of Chapter 13 filings were concentrated in the South. Louisiana’s share was 68%, followed by Alabama, Texas, and South Carolina (all more than 50%). At the other end of the spectrum were States with relatively low Chapter 13 shares; New Mexico and Iowa, for example, had less than 10% of their filings under Chapter 13.
Nationwide, filings to date amounted to about 1900 filings per million households – roughly 1 in every 530 households. As the attached map shows, the high filing rates are concentrated in two clusters: the Southwest and the Southeast. The states with the highest household-adjusted bankruptcy filing rates are Nevada (well more than twice the national average), followed by Georgia, Tennessee, and California. The lowest filing rates were in Alaska, South Dakota, North Dakota, and the District of Columbia, all with about one-third the national average.
At the county level, the counties with the highest filing rates (adjusting for households located in the county) were concentrated in Georgia. Eight of the ten counties with the highest filing rates were in Georgia, with the highest rate in the country (about four times the national average) occurring in Shelby County, Tennessee (Memphis). The second and third highest filing rates were in two suburban Atlanta counties (Douglas and Henry), both with filing rates more than three times the national average.
This analysis was performed on data collected by the National Bankruptcy Research Center (NBKRC) by NBKRC contributor Professor Ronald Mann of the Columbia Law School. 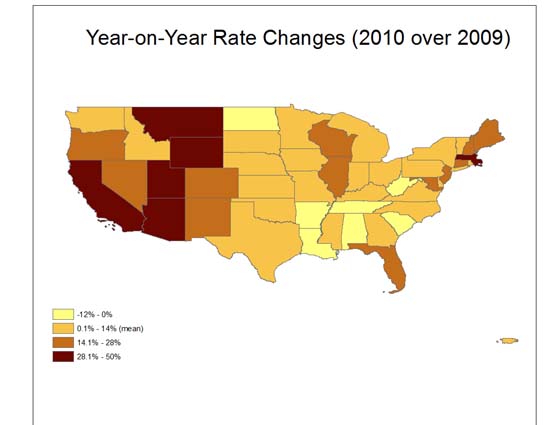
|
|